Imaging and Visualisation
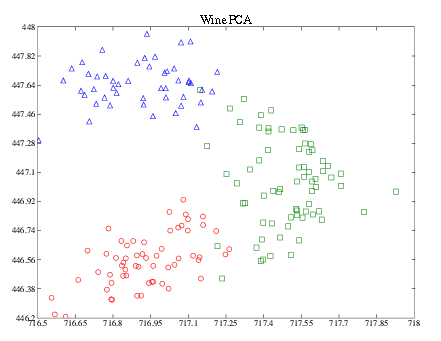
The assignment for this course involved performing some visualisations on a set of data. I made use of the supplied SOM (Self-Organising Maps) code and also used PCA (Principle Component Analysis). I made use of a couple of Python libraries to process and plot the data (matplotlib and numpy).
